You may know that if you check the position of the Sun every day in the same place at the same time (accounting for daylight saving time if necessary), you’ll find that it slightly moves. This is a combination of the tilt of the Earth’s axis and the Earth’s orbital eccentricity. The path traced out by the position in the sky of the Sun during its wandering is called analemma.

Afternoon analemma taken in 1998–99 by Jack Fishburn in Murray Hill, New Jersey, USA. Image credit: Jfishburn, Wikimedia Commons, GFDL 1.2+ and CC-BY-SA 3.0.
We can use Julia to plot the analemma. In particular, we’ll employ AstroLib.jl to do the needed calculations. Throughout this post I’ll assume you have installed the latest stable version of Julia and the necessary packages with the built-in package manager.
What we want to do is to determine the position of the Sun for a specific time every day in a year, say at noon for the whole 2018. This is the recipe:
- compute the Julian dates of all the wanted times
- calculate the equatorial coordinates for the given Julian dates
- convert the equatorial coordinates to horizontal coordinates in the desired place. For example, we choose Heidelberg, in Germany, which has coordinates 49°25′N 08°43′E and elevation of 114 m.
The trickiest part is to get the right Julian dates.
The
jdcnv function
in AstroLib.jl assumes that times are given
in UTC standard, but
Heidelberg is one hour ahead of Greenwich. In order to work around this issue
we can use the TimeZones.zdt2julian provided by
the TimeZones.jl package which
takes care of the time zones. In addition, Germany adopts daylight saving time
from March to October, thus noon on May 15th is not actually the
same time of day as
noon on November 7th. However, noon on January 1st is the same time of day as
noon on December 31st, so we can create a range between these two times with
step one (Julian) day.
using AstroLib, TimeZones

function analemma(start_date, end_date,
                  latitude, longitude, elevation)
    julian_dates = TimeZones.zdt2julian(start_date):TimeZones.zdt2julian(end_date)
    right_ascension, declination = sunpos(julian_dates)
    altaz = eq2hor.(right_ascension, declination,
	                julian_dates, latitude, longitude, elevation)
    altitude = getindex.(altaz, 1)
    azimuth  = getindex.(altaz, 2)
    return azimuth, altitude
end
We have
used
sunpos to
get the position of the Sun in equatorial coordinates and converted them
with
eq2hor to
horizontal coordinates, specifying the coordinates of Heidelberg.
The broadcast version of this
function returns an array of 2-tuples, being the first element the altitude of
the Sun and the second element its azimuth. We’ve used getindex.(altaz, i) to
obtain the arrays with the i-th elements of the tuples. Now we can draw the
analemma. I recommend using
the Plots.jl package, which provides
a single interface to several different back-ends (GR, PyPlot, PGFPlots,
etc…).
using Plots, Base.Dates

azimuth, altitude =
    analemma(ZonedDateTime(2018,  1,  1, 12, tz"Europe/Berlin"),
             ZonedDateTime(2018, 12, 31, 12, tz"Europe/Berlin"),
             ten(49, 25), ten(8, 43), 114)

scatter(azimuth, altitude, aspect_ratio = :equal,
        xlabel = "Azimuth (°)", ylabel = "Altitude (°)")
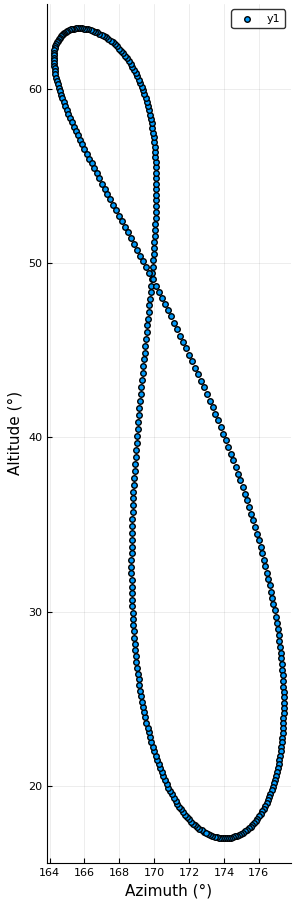
You can check with the JPL HORIZONS System that this is accurate within a few arcminutes.